

How Many Proposals Does an Upwork Job Get? We Measured 3.6 Million
Upwork shows you a bucket. "Less than 5." "20 to 50." It never shows you the number, and it never tells you the thing that actually decides whether your Connects were worth spending: whether that client was ever going to hire anybody.
We have both numbers. This post is what 3.6 million Upwork jobs and a minute-by-minute proposal tracker say about how crowded the platform really is.
The short answer
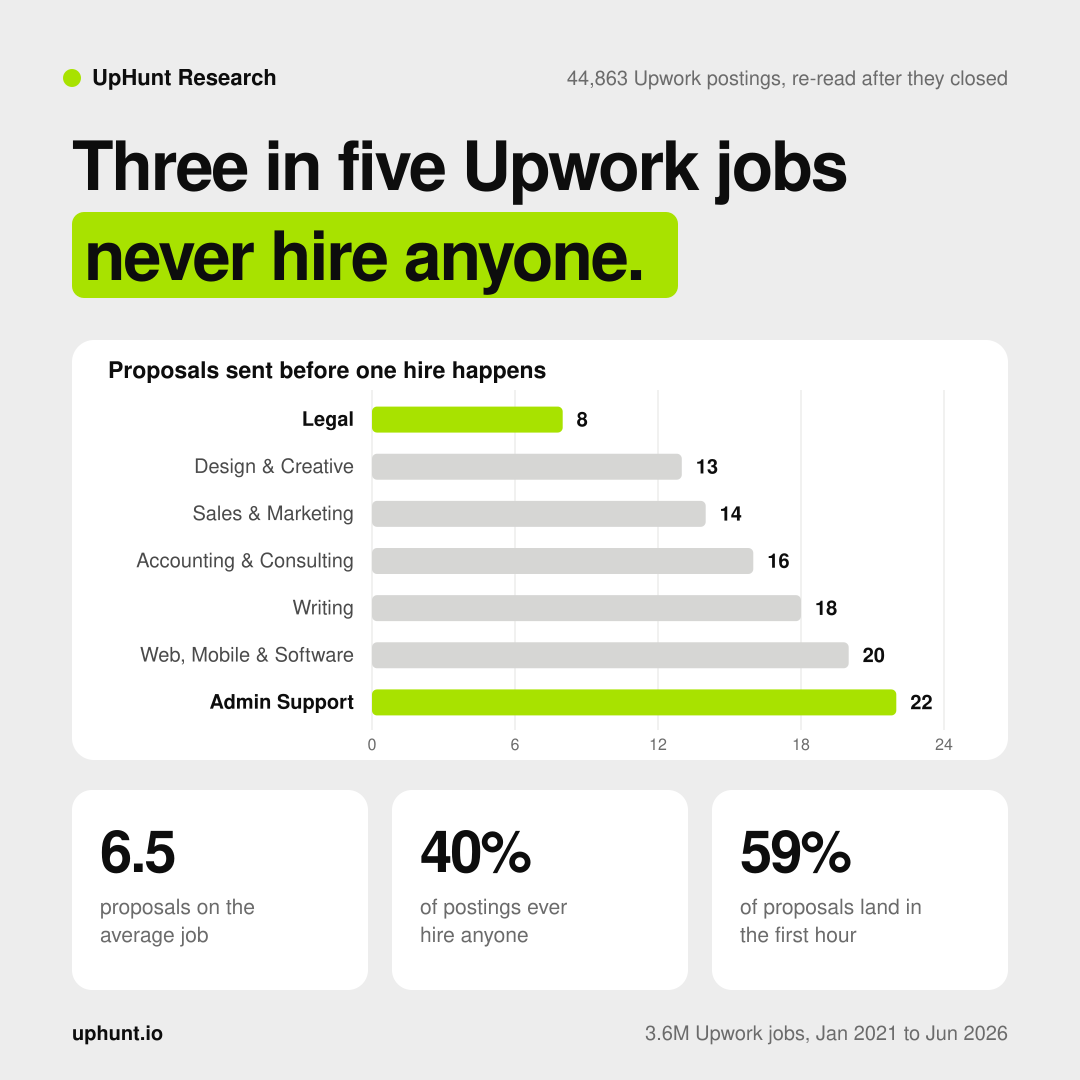
- The average Upwork job receives 6.5 proposals. Measured across 44,863 randomly sampled postings, read again after each one closed.
- The median job that closes has 11 proposals on it. Averages and medians differ here because a small number of jobs attract enormous crowds.
- Only 40% of postings ever hire anyone. Three in five jobs on Upwork end with no hire at all.
- It takes about 11 proposals for one hire to happen, market wide, and that ratio swings from 8 to 22 depending on the category.
- Six in ten proposals arrive within the first hour of the job going live.
The number that changes how you should think about Connects is the third one. Competition is not your main problem. Jobs that were never real are.
How many proposals does the average Upwork job get?
6.5 proposals, on average, per posting.
That figure comes from a random sample of 44,863 jobs from our own scrape, each one re-read after it closed so the count is final rather than a snapshot taken while the job was still collecting. This matters more than it sounds. Most public claims about Upwork competition are taken from jobs that are still open, which systematically undercounts them.
The distribution is heavily skewed. A quarter of jobs finish with four proposals or fewer. The busiest tenth finish with more than 41. So "average" is a poor guide to any single job you are looking at, which is exactly why the category breakdown below is more useful than the headline.
How many people apply to Upwork jobs, by category
Here is the part Upwork does not publish. Mean proposals per posting, and the proposals it takes before one hire happens, by category group:
| Category group | Proposals per job | Proposals per hire |
|---|---|---|
| Legal | 3.3 | 8 |
| Sales & Marketing | 4.7 | 14 |
| Design & Creative | 5.5 | 13 |
| Engineering & Architecture | 5.7 | 13 |
| Accounting & Consulting | 6.2 | 16 |
| IT & Networking | 6.5 | 17 |
| Customer Service | 6.5 | 21 |
| Translation | 7.0 | 14 |
| Data Science & Analytics | 7.5 | 18 |
| Writing | 7.6 | 18 |
| Web, Mobile & Software Dev | 8.0 | 20 |
| Admin Support | 9.6 | 22 |
Web, mobile and software development is the most crowded corner of Upwork, and admin support is worse on raw proposal count. Legal is the quietest by a wide margin, drawing less than half the market average.
Before you pivot into legal work, read the next section. Quiet categories are usually quiet for a reason.
Why the quietest niches are not the easy ones
Legal gets 3.3 proposals a job because most freelancers cannot take the work. A large share of legal postings require a specific jurisdiction, and one of the best-paying skills in the category is literally membership of a state bar association.
The same pattern repeats everywhere competition looks thin:
- Videography and local photography draw about five proposals a job, and roughly 60% of those postings are locked to a country, because somebody has to physically be in the room.
- Paralegal work is similar, with 44% of postings carrying a location or licence requirement.
Low competition on Upwork is usually a barrier rather than a secret. The genuinely useful question is not "where are there fewest proposals" but "where are there fewest proposals among jobs I am actually eligible for".
Only 40% of Upwork jobs hire anyone
This is the finding that should change how you spend Connects.
Across those 44,863 closed postings, 60% ended without a single hire. The client posted, collected proposals, and walked away. Every Connect spent on those jobs bought nothing, no matter how good the proposal was.
It gets sharper at category level. In our live tracker, hourly sales and lead generation postings hire at 3% to 13%, against a market rate of 24% for hourly work. Fixed-price postings hire far more reliably, at about 39%.
That difference is larger than any advantage a better cover letter can give you. A proposal on a fixed-price job is worth roughly two and a half times one on an hourly job, purely because the job is more likely to be real.
The first hour decides most of it
We run a tracker that reads the exact proposal count on every job we scrape, every minute for its first hour, then hourly, then daily. Across the jobs it has followed to completion:
- The median job has 6 proposals within one hour of going live.
- It reaches five proposals in about 20 minutes.
- 59% of every proposal a job will ever receive arrives in that first hour.
The spread by category is dramatic. A web design job carries 29 proposals before the hour is out. A lead generation job carries three.
So the practical ranking of what matters is: be eligible, be early, be on a job that will actually hire. Proposal quality decides between the handful of people who cleared those three, and it cannot rescue a proposal that arrives on hour six of a job that was never going to hire.
What this means for your Connects
Three rules fall out of the numbers.
- Filter for eligibility before you filter for competition. A niche that looks uncrowded because it needs a licence you do not hold is not an opportunity.
- Favour fixed-price work when the alternative is equal. It hires at 39% against 24%, and that gap dwarfs everything you can control in the proposal itself.
- Speed beats polish at the margin. If six in ten proposals land in the first hour, a good proposal sent at minute 20 beats a great one sent at hour four.
If you want to go further into where the money is rather than where the crowd is, we mapped the highest-paying Upwork niches with real hourly rates and clustered 46,269 jobs into 101 niches in earlier analyses.
How we measured this
Two independent datasets, because neither is complete on its own.
Contract data. 3,596,353 Upwork jobs and 4,431,966 contracts from January 2021 to June 2026, with each job's final applicant and hire count read after the posting closed. This is where realized contract values and proposals-per-hire come from. Its limitation is that it only contains jobs that were filled.
A random census plus a live tracker. 44,863 randomly sampled postings re-read after closing, including the ones that never hired, which is where the 40% fill rate and the 6.5 average come from. On top of that, a tracker that has followed every scraped job minute by minute since 14 September 2026, which is where the arrival curve comes from.
One honest caveat. Jobs that end up hiring draw two to three times the proposals of an average posting, so any analysis built only on filled jobs overstates competition. That is why the headline figures here come from the random census rather than the contract data.
Stop bidding blind
Upwork gives you a bucket and a refresh button. The freelancers winning in 2026 are the ones who see the job in the minute it appears and can tell a real client from a tyre-kicker before spending a Connect.
That is what UpHunt does. It watches every public Upwork job as it is posted, scores it against your profile, and tells you why it fits in plain language, along with what the client has actually spent and hired before. You can explore the underlying market data on our Upwork jobs data page, or start free at uphunt.io and get the jobs worth your Connects the minute they go live.